Market Outlook
June 12, 2017
Market Cues
Domestic Indices
Chg (%)
(Pts)
(Close)
Indian markets are likely to open flat and may trade in positive zone tracking the
BSE Sensex
0.2
0.3
49
86
31,26222
SGX Nifty and Asian markets.
Nifty
0.2
0.4
21
33
9,668136
After reaching record intraday highs early in the session, US markets gave back
Mid Cap
0.3
0.7
41
95
14,87585
some ground over the course of the trading day on Friday. The tech-heavy Nasdaq
Small Cap
0.5
1.1
77
171
15,54928
pulled back firmly into negative territory, but the Dow managed to close in positive
territory. The sharp pullback seen by the Nasdaq came as traders cashed in on
Bankex
0.5
138
26,820
some of the recent strength among technology stocks.
Global Indices
Chg (%)
(Pts)
(Close)
The European markets ended Friday's session with modest gains. Investors were
largely able to shrug off the inconclusive results of the U.K. election. A drop in the
Dow Jones
0.4
189
21,272
value of the British pound provided a boost to the FTSE 100.
Nasdaq
(1.8)
114
6,208
FTSE
1.0
77.4
7,527
Indian markets recouped early losses to finish marginally higher on Friday after
global markets took the inconclusive U.K. election result as well as former FBI
Nikkei
(00.5
104
20,013
Director James Comey's Senate testimony in their stride.
Hang Seng
(0.1)
(33)
26,030
Shanghai Com
0.3
8
3,158
News Analysis
DLF's FY18 rental income to rise 12% at `2,900cr on better realisations
Advances / Declines
BSE
NSE
Detailed analysis on Pg2
Advances
1,387
1,836
Investor’s Ready Reckoner
Declines
1,321
825
Key Domestic & Global Indicators
Unchanged
167
87
Stock Watch: Latest investment recommendations on 150+ stocks
Refer Pg5 onwards
Volumes (` Cr)
BSE
3,356
Top Picks
CMP
Target
Upside
NSE
22,334
Company
Sector
Rating
(`)
(`)
(%)
Blue Star
Capital Goods
Buy
628
760
21.1
Dewan Housing Fin. Financials
Buy
436
520
19.3
#Net Inflows (` Cr)
Net
Mtd
Ytd
Mahindra Lifespace Real Estate
Buy
419
522
24.7
FII
(2,073
(1,421)
50,548
Navkar Corporation Others
Buy
219
265
20.8
MFs
804(1)
1,114
31,154
KEI Industries
Capital Goods
Buy
219
258
17.6
More Top Picks on Pg3
Top Gainers
Price (`)
Chg (%)
Key Upcoming Events
Nhpccem
133
5.7
Previous
Consensus
Date
Region
Event Description
Pel
2,946
5.0
Reading
Expectations
Jun 12, 2017 UK
CPI (YoY)
2.70
2.70
Natcopharm
1,072
4.9
Jun 13, 2017 India
Industrial Production YoY
2.70
2.80
Dlf
185
4.9
Jun 13, 2017 US
Producer Price Index (mom)
0.60
Ncc
90
4.7
Jun 14, 2017 UK
Jobless claims change
19.40
Jun 14, 2017 India
Imports YoY%
49.10
Top Losers
Price (`)
Chg (%)
Jun 14, 2017 India
Exports YoY%
19.80
More Events on Pg4
Videoind
229
(5.0)
Ubl
789
(3.8)
Mfsl
600
(3.4)
Indhotel
132
(2.9)
Techm
387
(2.7)
#as on 9th June, 2017
Market Outlook
June 12, 2017
News Analysis
DLF's FY18 rental income to rise 12% at `2,900cr on better
realizations
Realty major DLF's total rental income will rise by 12 per cent to about `2,900cr
this financial year (FY) on better realisation from existing commercial assets and
addition of new properties in Chennai and Delhi. DLF, the country's largest real
estate firm, earned a rental income of around
`2,600cr last Fiscal.
DLF Managing Director (Rental Buisness) Sriram Khattar said that the rentals will
rise as the company has renewed its existing stock at a higher value after the
expiry of 9-year leasing agreement with the occupiers. Moreover, about one
million sq ft area will get added this fiscal in Chennai and the national capital.
Given the quality of office buildings and shopping malls as well as focus on safety,
compliance and sustainability, an overwhelming majority of tenants renew their
leases on term expiries at market rates. In addition, about 8 lakh sq ft in Chennai
and about 1.9 lakh sq ft in Chanakya Puri, Delhi will be the new assets that will
add to the rental income
Economic and Political News
Forex kitty at life-time high of $381.167 bn
Textile units worried over 18% GST, say may hurt small units badly, fear job
cuts
Govt to kick start process for `60kcr submarine programme
With GST rates finalised, FPIs pumped in $2bn in seven trading sessions
Corporate News
HPCL gets environment clearance for `230cr pipeline expansion project
`15,000cr stake sale satisfies capital needs for at least a year, says SBI
Passenger vehicle sales rise 9% in May; car sales up by 5%
Zydus' Nesher Pharma gets US FDA nod for antifungal drug
Market Outlook
June 12, 2017
Top Picks ★★★★★
Market Cap
CMP
Target
Upside
Company
Rationale
(` Cr)
(`)
(`)
(%)
Strong growth in domestic business due to its leadership
in acute therapeutic segment. Alkem expects to launch
Alkem Laboratories
22,599
1,890
2,161
14.3
more products in USA, which bodes for its international
business.
We expect the company would report strong profitability
Asian Granito
1,185
394
447
13.5
owing to better product mix, higher B2C sales and
amalgamation synergy..
Favourable outlook for the AC industry to augur well for
Cooling products business which is out pacing the market
Blue Star
6,001
628
760
21.1
growth. EMPPAC division's profitability to improve once
operating environment turns around..
With a focus on the low and medium income (LMI)
consumer segment, the company has increased its
Dewan Housing Finance
13,653
436
520
19.3
presence in tier-II & III cities where the growth opportunity
is immense.
Loan growth is likely to pick up after a sluggish FY17.
Karur Vysya Bank
7,850
130
160
23.2
Lower credit cost will help in strong bottomline growth.
Increasing share of CASA will help in NIM improvement.
Economic recovery to have favourable impact on
advertising & circulation revenue growth. Further, the
Jagran Prakashan
6,081
186
225
21.0
acquisition of a radio business (Radio City) would also
boost the company's revenue growth.
High order book execution in EPC segment, rising B2C
KEI Industries
1,707
219
258
17.6
sales and higher exports to boost the revenues and
profitability
Speedier execution and speedier sales, strong revenue
Mahindra Lifespace
2,148
419
522
24.7
visibilty in short-to-long run, attractive valuations
Massive capacity expansion along with rail advantage at
Navkar Corporation
3,129
219
265
20.8
ICD as well CFS augurs well for the company
Market leadership in Hindi news genre and no.
2
viewership ranking in English news genre, exit from the
TV Today Network
1,586
266
344
29.4
radio business, and anticipated growth in ad spends by
corporates to benefit the stock.
Source: Company, Angel Research
Market Outlook
June 12, 2017
Key Upcoming Events
Global economic events release calendar
Bloomberg Data
Date
Time
Country
Event Description
Unit
Period
Last Reported
Estimated
Jun 12, 2017
2:00 PMUK
CPI (YoY)
% Change
May
2.70
2.70
Jun 13, 2017
5:30 PMIndia
Industrial Production YoY
% Change
Apr
2.70
2.80
US
Producer Price Index (mom)
% Change
May
0.60
Jun 14, 2017
2:00 PMUK
Jobless claims change
% Change
May
19.40
India
Imports YoY%
% Change
May
49.10
India
Exports YoY%
% Change
May
19.80
7:30 AMChina
Industrial Production (YoY)
% Change
May
6.50
6.40
6:00 PMUS
Consumer price index (mom)
% Change
May
0.20
-
12:00 PMIndia
Monthly Wholesale Prices YoY%
% Change
May
3.85
3.10
11:30 PMUS
FOMC rate decision
%
Jun 14
1.00
1.25
Jun 15, 2017
6:00 PMUS
Initial Jobless claims
Thousands
Jun 10
245.00
241.50
6:45 PMUS
Industrial Production
%
May
0.98
0.15
4:30 PMUK
BOE Announces rates
% Ratio
Jun 15
0.25
0.25
Jun 16, 2017
2:30 PMEuro Zone
Euro-Zone CPI (YoY)
%
May F
1.40
1.40
6:00 PMUS
Housing Starts
Thousands
May
1,172.00
1,220.00
7:30 PMUS
Existing home sales
Million
May
5.57
5.58
Jun 21, 2017
6:00 PMUS
Building permits
Thousands
May
1,228.00
1,250.00
Jun 22, 2017
7:30 PMEuro Zone
Euro-Zone Consumer Confidence
Value
Jun A
(3.30)
Jun 23, 2017
1:00 PMGermany
PMI Services
Value
Jun P
55.40
1:00 PMGermany
PMI Manufacturing
Value
Jun P
59.50
7:30 PMUS
New home sales
Thousands
May
569.00
600.00
Jun 27, 2017
7:30 PMUS
Consumer Confidence
S.A./ 1985=100
Jun
117.90
Source: Bloomberg, Angel Research
Market Outlook
June 12, 2017
Macro watch
Exhibit 1: Quarterly GDP trends
Exhibit 2: IIP trends
(%)
(%)
10.0
10.0
9.1
8.9
8.8
9.0
8.0
9.0
7.9
8.0
7.9
8.0
7.6
7.5
8.0
7.3
7.2
7.0
7.0
5.7
5.7
7.0
6.0
5.2
4.9
4.9
6.1
6.1
5.0
6.0
3.8
4.0
2.6
2.7
5.0
3.0
1.9
4.0
2.0
1.0
3.0
-
Source: CSO, Angel Research
Source: MOSPI, Angel Research
Exhibit 3: Monthly CPI inflation trends
Exhibit 4: Manufacturing and services PMI
56.0
Mfg. PMI
Services PMI
(%)
7.0
54.0
6.1
5.8
5.8
6.0
5.1
52.0
5.0
4.3
4.2
3.9
50.0
3.6
3.7
4.0
3.4
3.2
3.0
48.0
3.0
46.0
2.0
1.0
44.0
-
42.0
Source: MOSPI, Angel Research
Source: Market, Angel Research; Note: Level above 50 indicates expansion
Exhibit 5: Exports and imports growth trends
Exhibit 6: Key policy rates
(%)
Exports yoy growth
Imports yoy growth
(%)
Repo rate
Reverse Repo rate
CRR
60.0
7.00
50.0
6.50
40.0
6.00
30.0
5.50
20.0
5.00
10.0
4.50
0.0
4.00
(10.0)
(20.0)
3.50
(30.0)
3.00
Source: Bloomberg, Angel Research
Source: RBI, Angel Research
Market Outlook
June 12, 2017
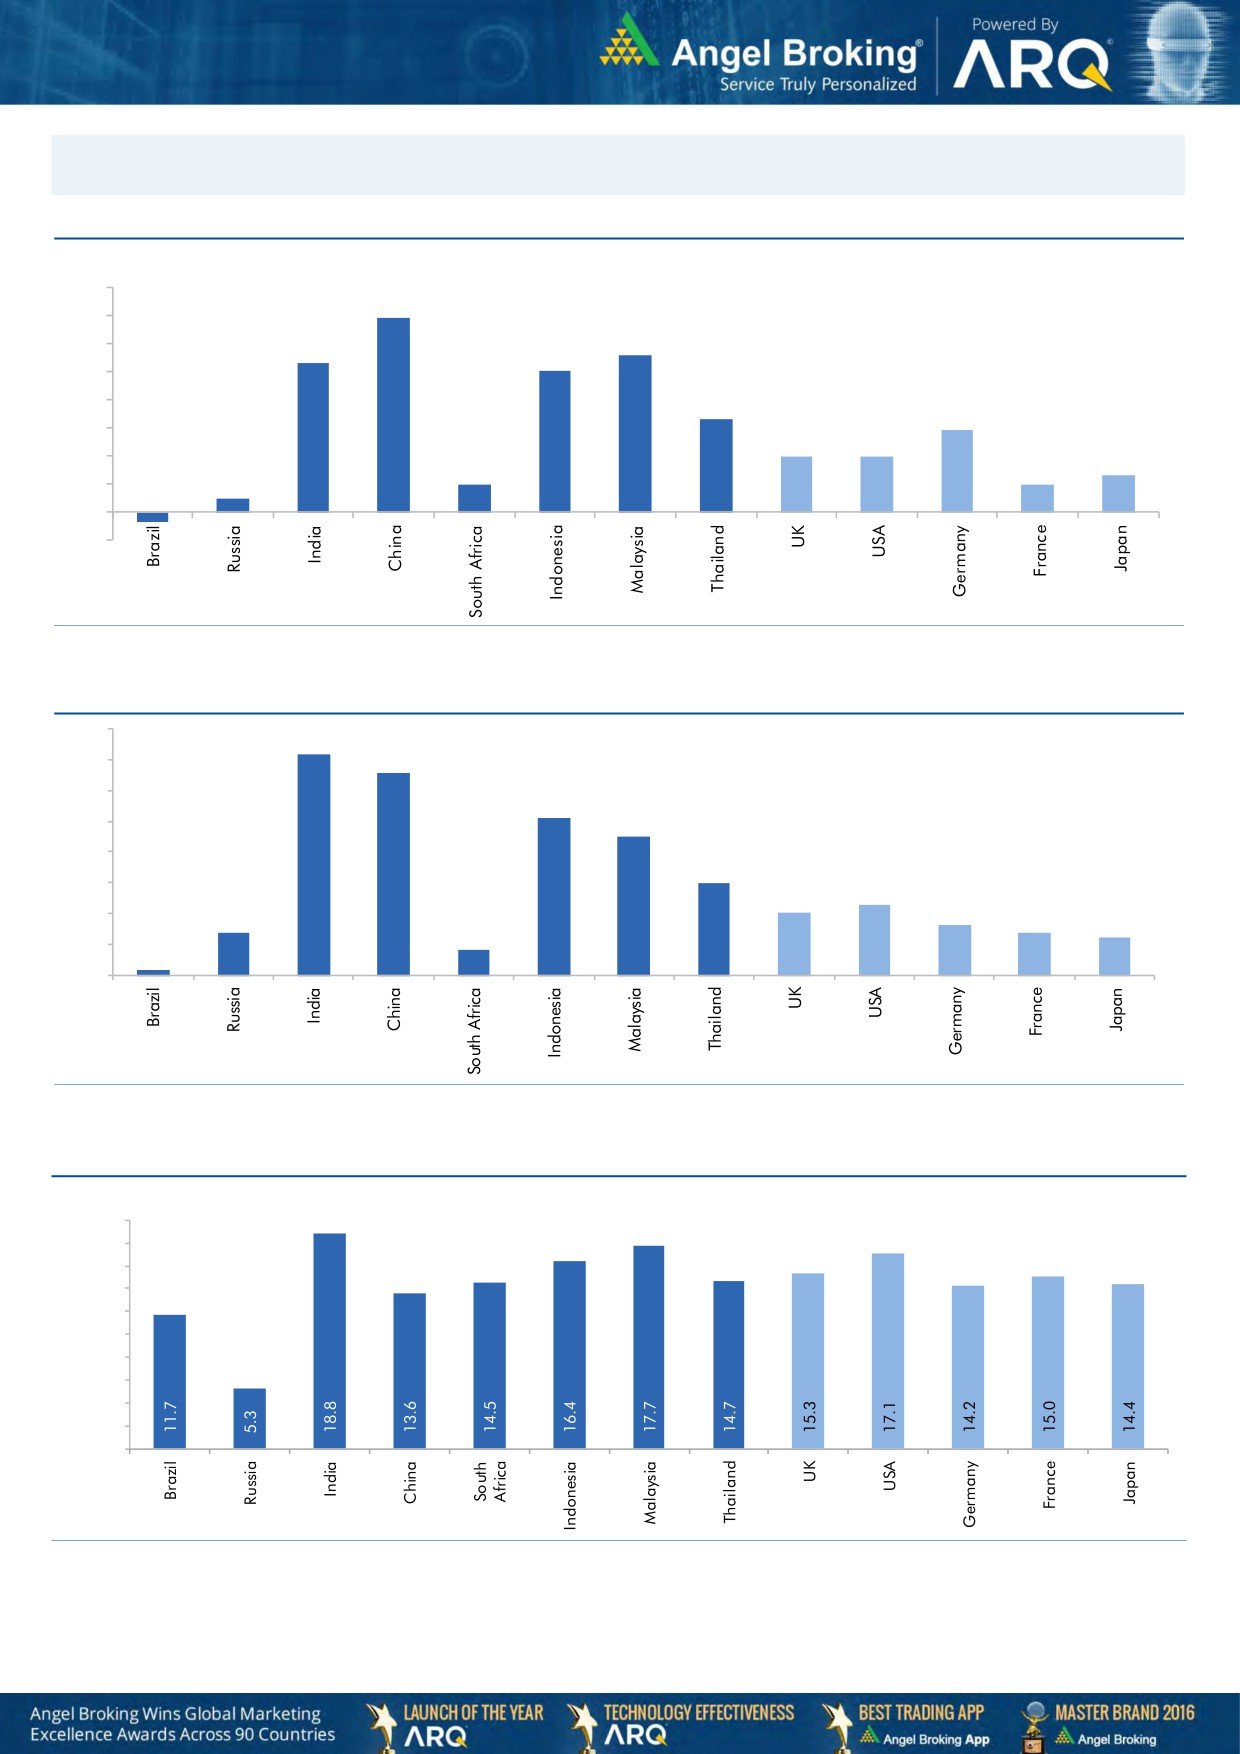
Global watch
Exhibit 1: Latest quarterly GDP Growth (%, yoy) across select developing and developed countries
(%)
8.0
6.9
7.0
5.6
6.0
5.3
5.0
1.0
5.0
4.0
3.3
2.9
3.0
2.0
2.0
0.5
2.0
1.0
1.3
1.0
-
(1.0)
(0.4)
Source: Bloomberg, Angel Research
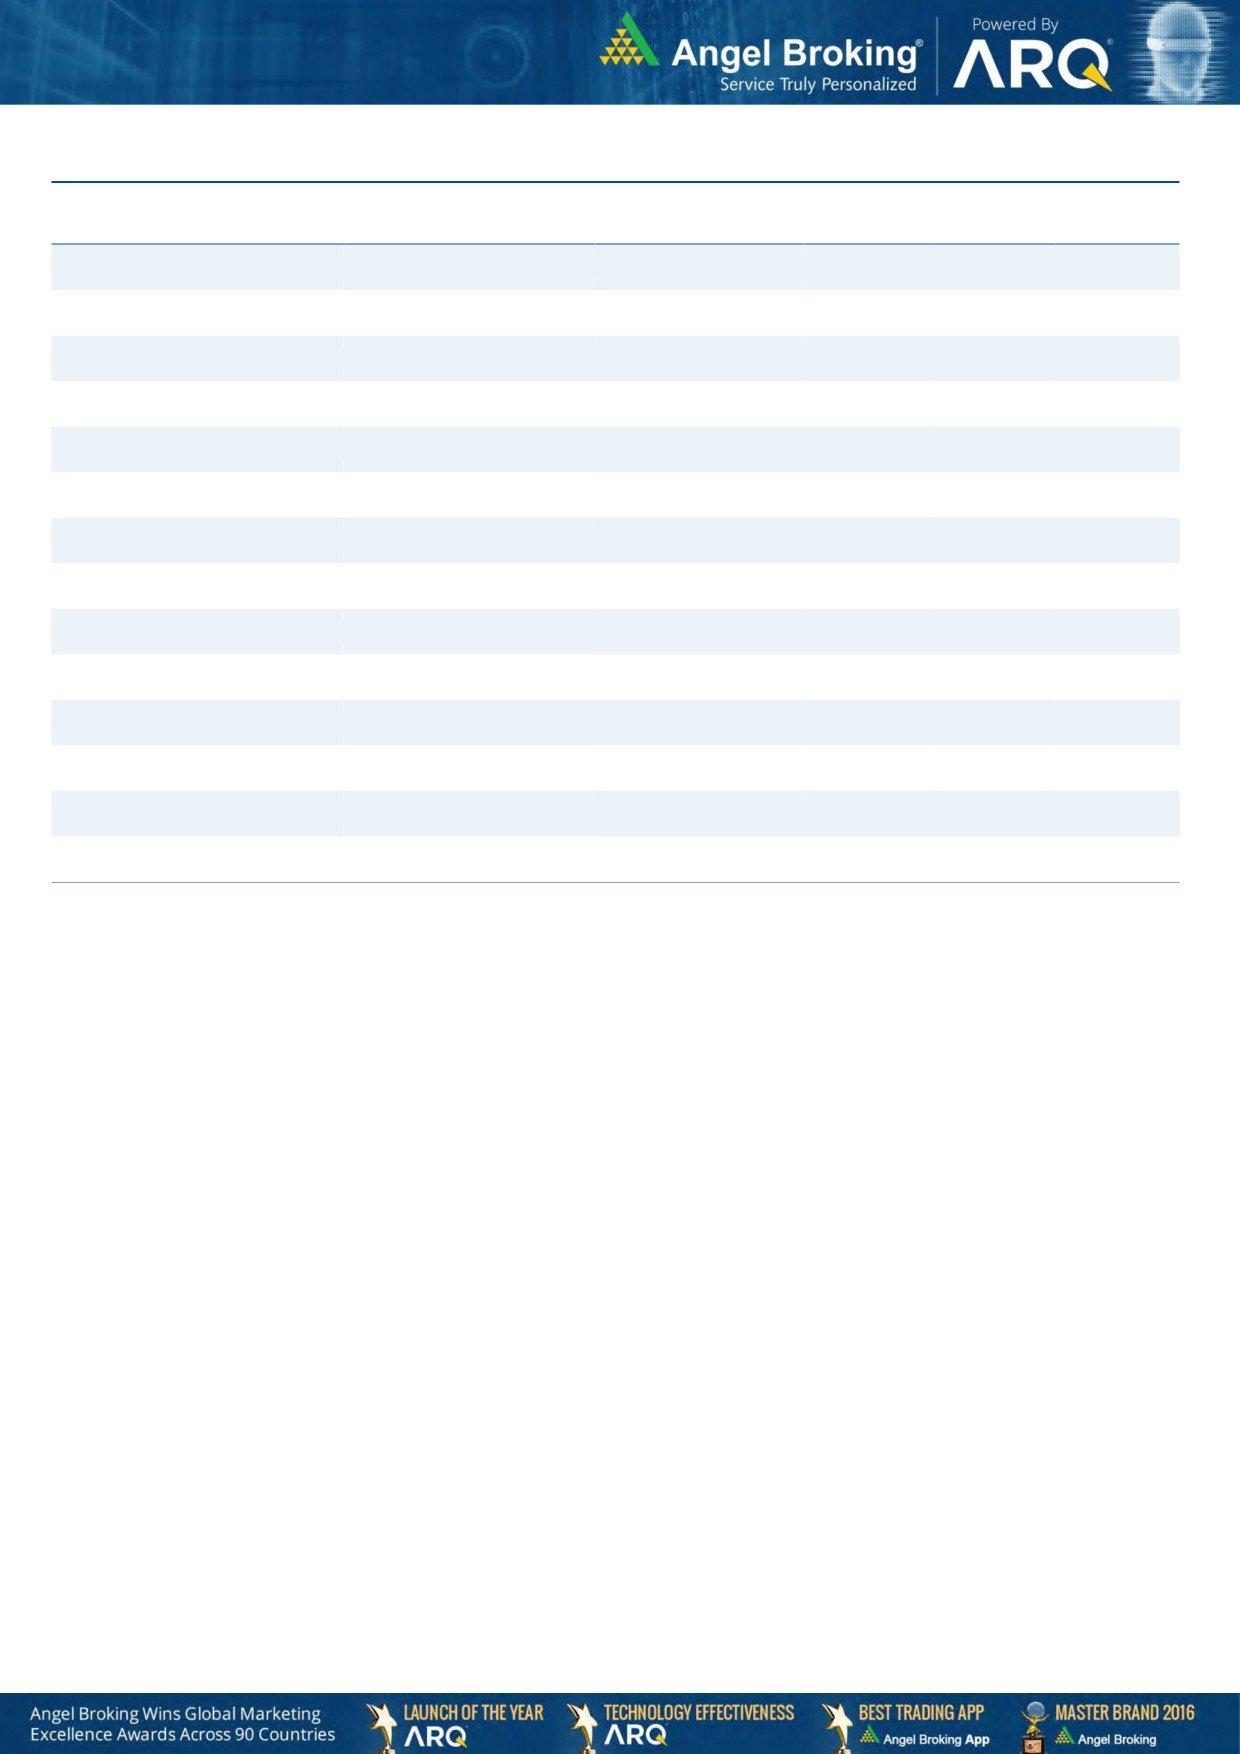
Exhibit 2: 2016 GDP Growth projection by IMF (%, yoy) across select developing and developed countries
(%)
7.2
7.0
6.6
6.0
5.1
5.0
4.5
4.0
3.0
3.0
2.3
2.0
1.4
1.6
2.0
1.4
1.2
0.2
0.8
1.0
-
Source: IMF, Angel Research
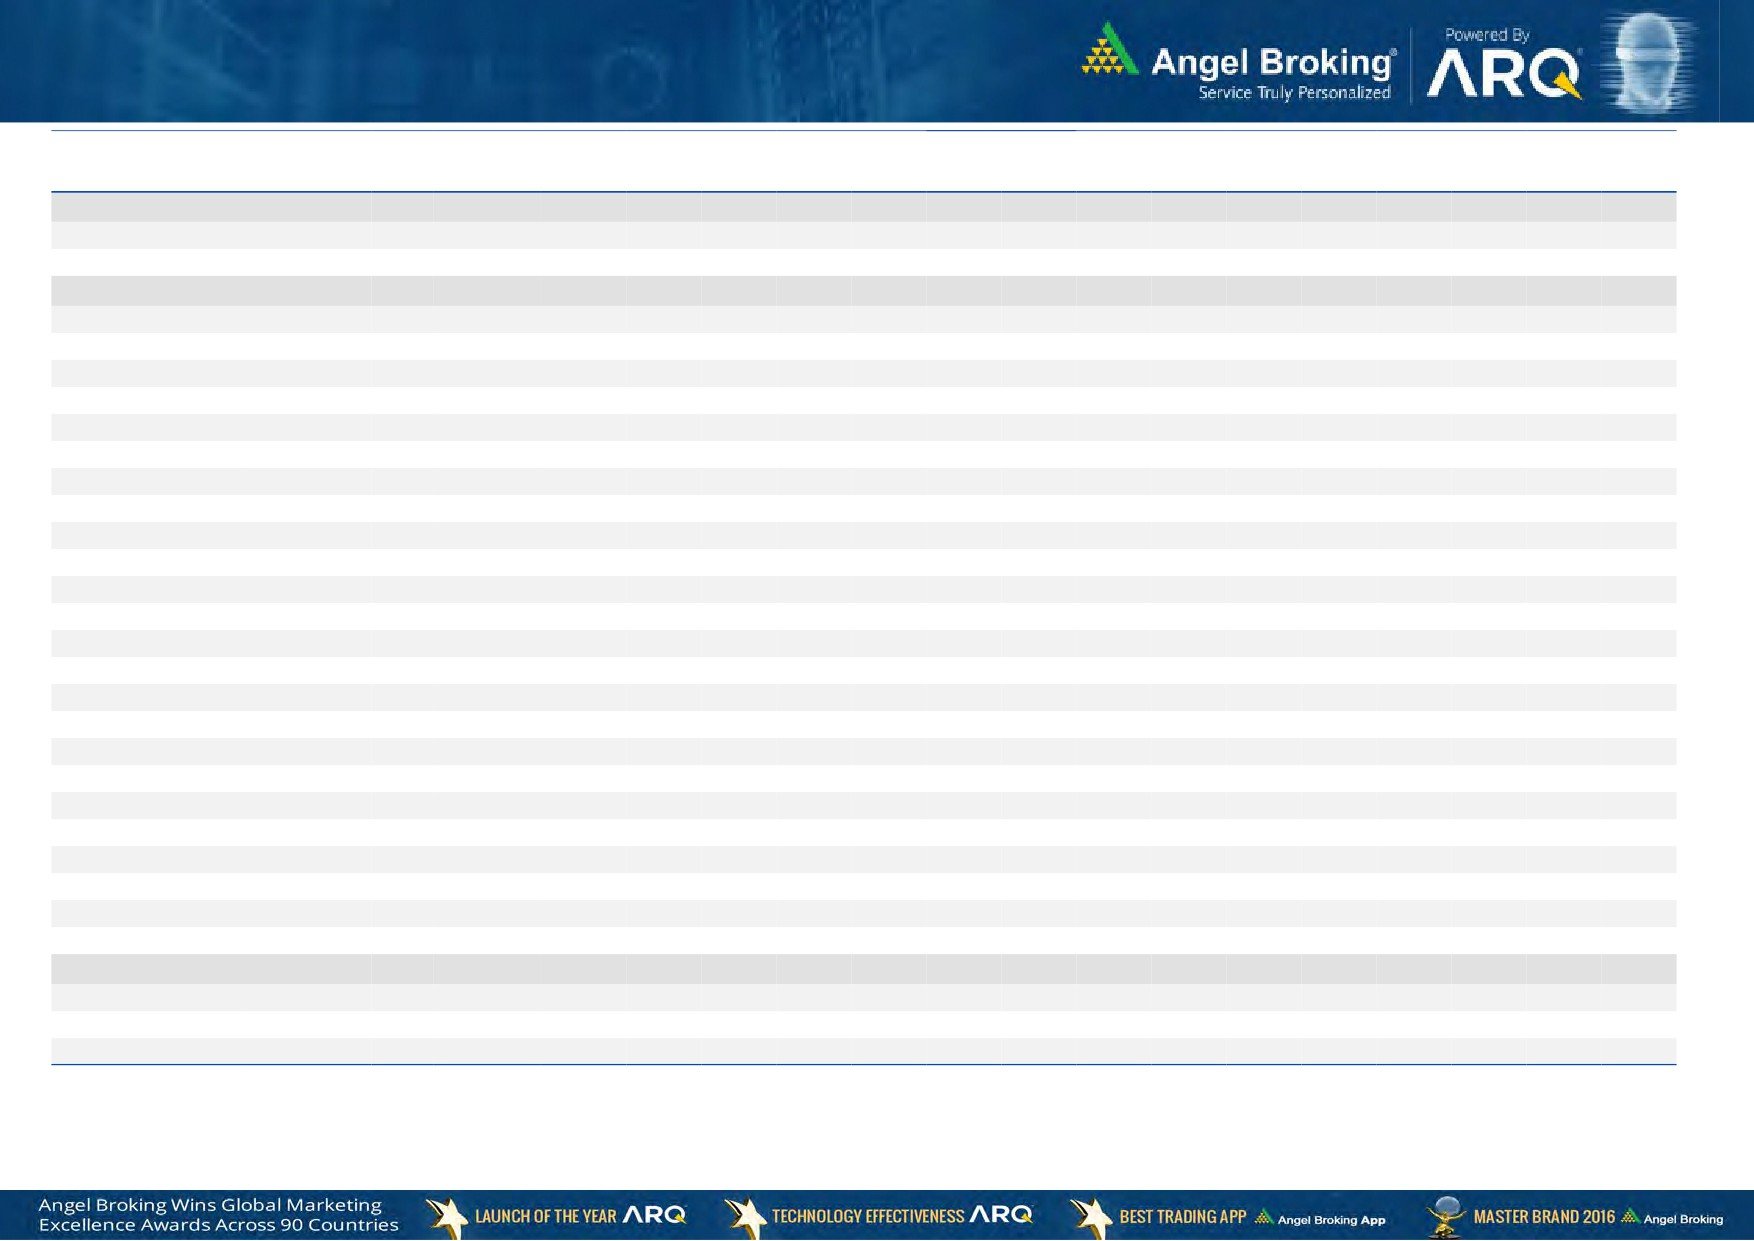
Exhibit 3: One year forward P-E ratio across select developing and developed countries
(x)
20.0
18.0
16.0
14.0
12.0
10.0
8.0
6.0
4.0
2.0
-
Source: IMF, Angel Research
Market Outlook
June 12, 2017
Exhibit 4: Relative performance of indices across globe
Returns (%)
Country
Name of index
Closing price
1M
3M
1YR
Brazil
Bovespa
62,756
(5.3)
(4.5)
24.3
Russia
Micex
1,874
(7.4)
(7.2)
(0.4)
India
Nifty
9,647
2.8
8.1
17.9
China
Shanghai Composite
3,150
2.6
(2.3)
11.9
South Africa
Top 40
45,734
(4.0)
2.9
(4.8)
Mexico
Mexbol
49,087
(1.7)
2.5
7.5
Indonesia
LQ45
956
0.5
7.0
15.0
Malaysia
KLCI
1,786
1.0
3.5
9.8
Thailand
SET 50
991
(0.6)
1.2
8.9
USA
Dow Jones
21,183
0.8
1.6
17.8
UK
FTSE
7,450
2.0
1.4
21.8
Japan
Nikkei
19,909
0.3
2.7
17.4
Germany
DAX
12,714
0.1
6.7
32.9
France
CAC
5,264
(2.2)
6.4
25.9
Source: Bloomberg, Angel Research
Stock Watch
June 12, 2017
Company Name
Reco
CMP
Target
Mkt Cap
Sales ( Čcr )
OPM(%)
EPS (Č)
PER(x)
P/BV(x)
RoE(%)
EV/Sales(x)
(Č)
Price ( Č)
( Č cr )
FY17E FY18E
FY17E
FY18E
FY17E
FY18E
FY17E
FY18E
FY17E
FY18E
FY17E
FY18E
FY17E
FY18E
Agri / Agri Chemical
Rallis
Neutral
249
-
4,845
1,937
2,164
13.3
14.3
9.0
11.0
27.7
22.7
4.8
4.2
18.4
19.8
2.5
2.2
United Phosphorus
Neutral
857
-
43,516
15,176
17,604
18.5
18.5
37.4
44.6
22.9
19.2
4.5
3.7
21.4
21.2
3.0
2.5
Auto & Auto Ancillary
Ashok Leyland
Buy
95
111
26,936
20,021
21,915
11.6
11.9
4.5
5.3
21.0
17.8
4.3
3.8
20.6
21.5
1.3
1.2
Bajaj Auto
Neutral
2,866
-
82,935
25,093
27,891
19.5
19.2
143.9
162.5
19.9
17.6
5.6
4.8
30.3
29.4
3.0
2.7
Bharat Forge
Neutral
1,178
-
27,416
7,726
8,713
20.5
21.2
35.3
42.7
33.4
27.6
6.2
5.6
18.9
20.1
3.6
3.2
Eicher Motors
Neutral
29,765
-
81,026
16,583
20,447
17.5
18.0
598.0
745.2
49.8
39.9
17.0
13.0
41.2
38.3
4.7
3.8
Gabriel India
Neutral
143
-
2,059
1,544
1,715
9.0
9.3
5.4
6.3
26.6
22.8
5.0
4.4
18.9
19.5
1.3
1.1
Hero Motocorp
Neutral
3,779
-
75,472
28,083
30,096
15.3
15.7
171.8
187.0
22.0
20.2
7.7
6.5
30.1
27.9
2.5
2.3
Jamna Auto Industries Neutral
264
-
2,101
1,486
1,620
9.8
9.9
15.0
17.2
17.6
15.3
3.8
3.3
21.8
21.3
1.5
1.3
L G Balakrishnan & Bros Neutral
750
-
1,177
1,302
1,432
11.6
11.9
43.7
53.0
17.2
14.2
2.4
2.2
13.8
14.2
1.0
0.9
Mahindra and Mahindra Neutral
1,427
-
88,599
46,534
53,077
11.6
11.7
67.3
78.1
21.2
18.3
3.4
3.0
15.4
15.8
1.9
1.6
Maruti
Neutral
7,451
-
225,080
67,822
83,288
16.0
16.4
253.8
312.4
29.4
23.9
6.7
5.5
23.0
22.9
3.0
2.4
Minda Industries
Neutral
624
-
5,390
2,728
3,042
9.0
9.1
68.2
86.2
9.2
7.2
2.1
1.7
23.8
24.3
2.0
1.8
Motherson Sumi
Neutral
459
-
64,479
45,896
53,687
7.8
8.3
13.0
16.1
35.2
28.5
11.4
9.1
34.7
35.4
1.5
1.2
Rane Brake Lining
Neutral
1,360
-
1,077
511
562
11.3
11.5
28.1
30.9
48.4
44.0
7.4
6.7
15.3
15.0
2.2
2.1
Setco Automotive
Neutral
39
-
525
741
837
13.0
13.0
15.2
17.0
2.6
2.3
0.4
0.4
15.8
16.3
1.1
1.0
Tata Motors
Neutral
467
-
134,897
300,209
338,549
8.9
8.4
42.7
54.3
11.0
8.6
1.8
1.5
15.6
17.2
0.6
0.5
TVS Motor
Neutral
552
-
26,208
13,390
15,948
6.9
7.1
12.8
16.5
43.2
33.3
10.8
8.5
26.3
27.2
2.0
1.7
Amara Raja Batteries
Buy
861
1,009
14,703
5,305
6,100
16.0
16.3
28.4
34.0
30.3
25.3
5.9
4.9
19.3
19.3
2.8
2.4
Exide Industries
Neutral
223
-
18,959
7,439
8,307
15.0
15.0
8.1
9.3
27.5
24.0
3.9
3.4
14.3
16.7
2.2
1.9
Apollo Tyres
Neutral
258
-
13,120
12,877
14,504
14.3
13.9
21.4
23.0
12.0
11.2
1.9
1.6
16.4
15.2
1.2
1.1
Ceat
Neutral
1,907
-
7,715
7,524
8,624
13.0
12.7
131.1
144.3
14.6
13.2
2.7
2.3
19.8
18.6
1.1
1.0
JK Tyres
Neutral
183
-
4,153
7,455
8,056
15.0
15.0
21.8
24.5
8.4
7.5
1.8
1.4
22.8
21.3
0.7
0.6
Swaraj Engines
Neutral
1,981
-
2,460
660
810
15.2
16.4
54.5
72.8
36.4
27.2
11.3
10.3
31.5
39.2
3.6
2.9
Subros
Neutral
264
-
1,585
1,488
1,681
11.7
11.9
6.4
7.2
41.3
36.9
4.4
4.0
10.8
11.4
1.3
1.1
Indag Rubber
Neutral
209
-
549
286
326
19.8
16.8
11.7
13.3
17.9
15.7
3.0
2.8
17.8
17.1
1.6
1.4
Capital Goods
ACE
Neutral
65
-
638
709
814
4.1
4.6
1.4
2.1
46.1
30.7
1.9
1.8
4.4
6.0
1.1
0.9
BEML
Neutral
1,283
-
5,343
3,451
4,055
6.3
9.2
31.4
57.9
40.9
22.2
2.5
2.2
6.3
10.9
1.7
1.4
Bharat Electronics
Neutral
168
-
37,581
8,137
9,169
16.8
17.2
58.7
62.5
2.9
2.7
0.4
0.4
44.6
46.3
3.6
3.2
Stock Watch
June 12, 2017
Company Name
Reco
CMP
Target
Mkt Cap
Sales ( Čcr )
OPM(%)
EPS (Č)
PER(x)
P/BV(x)
RoE(%)
EV/Sales(x)
(Č)
Price ( Č)
( Č cr )
FY17E
FY18E
FY17E
FY18E
FY17E
FY18E
FY17E
FY18E
FY17E
FY18E
FY17E
FY18E
FY17E
FY18E
Capital Goods
Voltas
Neutral
492
-
16,283
6,511
7,514
7.9
8.7
12.9
16.3
38.2
30.2
6.9
6.0
16.7
18.5
2.3
1.9
BGR Energy
Neutral
156
-
1,128
16,567
33,848
6.0
5.6
7.8
5.9
20.0
26.5
1.1
1.1
4.7
4.2
0.2
0.1
BHEL
Neutral
139
-
33,960
28,797
34,742
-
2.8
2.3
6.9
60.3
20.1
1.0
1.0
1.3
4.8
0.8
0.6
Blue Star
Buy
628
760
6,001
4,283
5,077
5.9
7.3
14.9
22.1
42.2
28.4
8.2
6.9
20.4
26.4
1.4
1.2
CG Power and Industrial
Neutral
84
-
5,293
5,777
6,120
5.9
7.0
3.3
4.5
25.6
18.8
1.1
1.1
4.4
5.9
0.9
0.7
Solutions
Greaves Cotton
Neutral
156
-
3,805
1,755
1,881
16.8
16.9
7.8
8.5
20.0
18.3
4.0
3.7
20.6
20.9
1.9
1.7
Inox Wind
Neutral
138
-
3,058
5,605
6,267
15.7
16.4
24.8
30.0
5.6
4.6
1.6
1.1
25.9
24.4
0.6
0.5
KEC International
Neutral
260
-
6,683
9,294
10,186
7.9
8.1
9.9
11.9
26.3
21.8
3.9
3.3
15.6
16.3
1.0
0.9
KEI Industries
Buy
219
258
1,707
2,633
3,001
10.4
10.0
12.7
13.0
17.2
16.9
3.7
3.1
21.4
18.2
0.8
0.7
Thermax
Neutral
965
-
11,495
5,421
5,940
7.3
7.3
25.7
30.2
37.5
31.9
4.5
4.2
12.2
13.1
2.0
1.8
VATech Wabag
Neutral
682
-
3,720
3,136
3,845
8.9
9.1
26.0
35.9
26.2
19.0
3.3
2.8
13.4
15.9
1.1
0.9
Cement
ACC
Neutral
1,622
-
30,466
11,225
13,172
13.2
16.9
44.5
75.5
36.5
21.5
3.5
3.2
11.2
14.2
2.7
2.3
Ambuja Cements
Neutral
235
-
46,692
9,350
10,979
18.2
22.5
5.8
9.5
40.5
24.8
3.4
3.1
10.2
12.5
5.0
4.3
India Cements
Neutral
214
-
6,566
4,364
4,997
18.5
19.2
7.9
11.3
27.1
18.9
1.9
1.9
8.0
8.5
2.3
2.0
JK Cement
Neutral
1,025
-
7,163
4,398
5,173
15.5
17.5
31.2
55.5
32.8
18.5
3.9
3.4
12.0
15.5
2.2
1.8
J K Lakshmi Cement
Neutral
480
-
5,651
2,913
3,412
14.5
19.5
7.5
22.5
64.0
21.3
3.9
3.3
12.5
18.0
2.5
2.1
Orient Cement
Neutral
159
-
3,257
2,114
2,558
18.5
20.5
8.1
11.3
19.6
14.1
2.9
2.5
9.0
14.0
2.2
1.7
UltraTech Cement
Neutral
4,117
-
113,007
25,768
30,385
21.0
23.5
111.0
160.0
37.1
25.7
4.7
4.1
13.5
15.8
4.5
3.7
Construction
ITNL
Neutral
97
-
3,193
8,946
10,017
31.0
31.6
8.1
9.1
12.0
10.7
0.4
0.5
4.2
5.0
3.7
3.4
KNR Constructions
Neutral
214
-
3,016
1,385
1,673
14.7
14.0
41.2
48.5
5.2
4.4
1.0
0.8
14.9
15.2
2.3
1.9
Larsen & Toubro
Neutral
1,777
-
165,840
111,017
124,908
11.0
11.0
61.1
66.7
29.1
26.6
3.5
3.2
13.1
12.9
2.5
2.3
Gujarat Pipavav Port
Neutral
143
-
6,899
705
788
52.2
51.7
5.0
5.6
28.5
25.5
2.8
2.5
11.2
11.2
9.4
8.0
Nagarjuna Const.
Neutral
90
-
5,020
8,842
9,775
9.1
8.8
5.3
6.4
17.0
14.1
1.4
1.2
8.2
9.1
0.7
0.6
PNC Infratech
Neutral
152
-
3,889
2,350
2,904
13.1
13.2
9.0
8.8
16.8
17.2
0.6
0.6
15.9
13.9
1.8
1.4
Simplex Infra
Neutral
534
-
2,642
6,829
7,954
10.5
10.5
31.4
37.4
17.0
14.3
1.8
1.6
9.9
13.4
0.8
0.7
Power Mech Projects
Neutral
585
-
861
1,801
2,219
12.7
14.6
72.1
113.9
8.1
5.1
1.5
1.3
16.8
11.9
0.5
0.4
Sadbhav Engineering
Neutral
311
-
5,329
3,598
4,140
10.3
10.6
9.0
11.9
34.5
26.1
3.6
3.2
9.9
11.9
1.8
1.5
NBCC
Neutral
199
-
17,870
7,428
9,549
7.9
8.6
8.2
11.0
24.2
18.1
1.2
1.0
28.2
28.7
2.1
1.6
MEP Infra
Neutral
92
-
1,498
1,877
1,943
30.6
29.8
3.0
4.2
30.7
21.9
14.9
10.0
0.6
0.6
2.2
2.0
Stock Watch
June 12, 2017
Company Name
Reco
CMP
Target
Mkt Cap
Sales ( Čcr )
OPM(%)
EPS (Č)
PER(x)
P/BV(x)
RoE(%)
EV/Sales(x)
(Č)
Price ( Č)
( Č cr )
FY17E
FY18E
FY17E
FY18E
FY17E
FY18E
FY17E
FY18E
FY17E
FY18E
FY17E
FY18E
FY17E
FY18E
Construction
SIPL
Neutral
113
-
3,980
1,036
1,252
65.5
66.2
(8.4)
(5.6)
4.2
4.8
(22.8)
(15.9)
12.1
10.0
Engineers India
Neutral
153
-
10,314
1,725
1,935
16.0
19.1
11.4
13.9
13.4
11.0
1.9
1.8
13.4
15.3
4.9
4.4
Financials
Axis Bank
Accumulate
513
580
123,062
46,932
53,575
3.5
3.4
32.4
44.6
15.9
11.5
2.0
1.8
13.6
16.5
-
-
Bank of Baroda
Neutral
174
-
40,012
19,980
23,178
1.8
1.8
11.5
17.3
15.1
10.0
1.7
1.4
8.3
10.1
-
-
Canara Bank
Neutral
360
-
21,520
15,225
16,836
1.8
1.8
14.5
28.0
24.9
12.9
1.7
1.4
5.8
8.5
-
-
Can Fin Homes
Neutral
2,989
-
7,958
420
526
3.5
3.5
86.5
107.8
34.6
27.7
7.4
6.1
23.6
24.1
-
-
Cholamandalam Inv. &
Buy
1,042
1,230
16,289
2,012
2,317
6.3
6.3
42.7
53.6
24.4
19.4
3.9
3.3
16.9
18.3
-
-
Fin. Co.
Dewan Housing Finance Buy
436
520
13,653
2,225
2,688
2.9
2.9
29.7
34.6
14.7
12.6
2.4
1.6
16.1
14.8
-
-
Equitas Holdings
Buy
156
235
5,283
939
1,281
11.7
11.5
5.8
8.2
27.0
19.1
2.3
2.1
10.9
11.5
-
-
Federal Bank
Accumulate
117
125
20,174
8,259
8,995
3.0
3.0
4.3
5.6
27.2
20.9
2.3
2.1
8.5
10.1
-
-
HDFC
Neutral
1,645
-
261,428
11,475
13,450
3.4
3.4
45.3
52.5
36.3
31.3
7.0
6.2
20.2
20.5
-
-
HDFC Bank
Neutral
1,667
-
428,196
46,097
55,433
4.5
4.5
58.4
68.0
28.5
24.5
5.0
4.2
18.8
18.6
-
-
ICICI Bank
Neutral
322
-
187,562
42,800
44,686
3.1
3.3
18.0
21.9
17.9
14.7
2.4
2.3
11.1
12.3
-
-
Karur Vysya Bank
Buy
130
160
7,850
5,640
6,030
3.3
3.2
8.9
10.0
14.6
13.0
1.6
1.4
11.2
11.4
-
-
Lakshmi Vilas Bank
Neutral
195
-
3,733
3,339
3,799
2.7
2.8
11.0
14.0
17.7
13.9
1.8
1.7
11.2
12.7
-
-
LIC Housing Finance
Neutral
758
-
38,241
3,712
4,293
2.6
2.5
39.0
46.0
19.4
16.5
3.6
3.1
19.9
20.1
-
-
Punjab Natl.Bank
Neutral
152
-
32,356
23,532
23,595
2.3
2.4
6.8
12.6
22.4
12.1
3.5
2.5
3.3
6.5
-
-
RBL Bank
Neutral
538
-
20,223
1,783
2,309
2.6
2.6
12.7
16.4
42.3
32.8
4.6
4.1
12.8
13.3
-
-
Repco Home Finance
Neutral
804
-
5,032
388
457
4.5
4.2
30.0
38.0
26.8
21.2
4.5
3.8
18.0
19.2
-
-
South Ind.Bank
Neutral
28
-
5,077
6,435
7,578
2.5
2.5
2.7
3.1
10.4
9.1
1.3
1.1
10.1
11.2
-
-
St Bk of India
Neutral
289
-
233,969
88,650
98,335
2.6
2.6
13.5
18.8
21.4
15.4
2.0
1.8
7.0
8.5
-
-
Union Bank
Neutral
158
-
10,889
13,450
14,925
2.3
2.3
25.5
34.5
6.2
4.6
0.9
0.8
7.5
10.2
-
-
Yes Bank
Neutral
1,486
-
67,937
8,978
11,281
3.3
3.4
74.0
90.0
20.1
16.5
3.8
3.2
17.0
17.2
-
-
FMCG
Akzo Nobel India
Neutral
1,797
-
8,619
2,955
3,309
13.3
13.7
57.2
69.3
31.4
25.9
10.3
8.6
32.7
33.3
2.7
2.4
Asian Paints
Neutral
1,154
-
110,720
17,128
18,978
16.8
16.4
19.1
20.7
60.4
55.8
21.0
19.8
34.8
35.5
6.4
5.8
Britannia
Neutral
3,668
-
44,017
9,594
11,011
14.6
14.9
80.3
94.0
45.7
39.0
18.8
14.5
41.2
-
4.5
3.8
Colgate
Neutral
1,075
-
29,245
4,605
5,149
23.4
23.4
23.8
26.9
45.2
40.0
25.0
19.6
64.8
66.8
6.3
5.6
Dabur India
Accumulate
282
304
49,631
8,315
9,405
19.8
20.7
8.1
9.2
34.8
30.6
9.7
8.0
31.6
31.0
5.6
4.9
GlaxoSmith Con*
Neutral
5,388
-
22,661
4,350
4,823
21.2
21.4
179.2
196.5
30.1
27.4
8.0
6.8
27.1
26.8
4.6
4.1
Stock Watch
June 12, 2017
Company Name
Reco
CMP
Target
Mkt Cap
Sales ( Čcr )
OPM(%)
EPS (Č)
PER(x)
P/BV(x)
RoE(%)
EV/Sales(x)
(Č)
Price ( Č)
( Č cr )
FY17E FY18E
FY17E
FY18E
FY17E
FY18E
FY17E
FY18E
FY17E
FY18E
FY17E
FY18E
FY17E
FY18E
FMCG
Godrej Consumer
Neutral
1,883
-
64,150
10,235
11,428
18.4
18.6
41.1
44.2
45.8
42.6
10.2
8.6
24.9
24.8
6.4
5.6
HUL
Neutral
1,095
-
237,052
35,252
38,495
17.8
17.8
20.7
22.4
53.1
48.9
50.7
43.5
95.6
88.9
6.6
6.0
ITC
Neutral
306
-
371,953
40,059
44,439
38.3
39.2
9.0
10.1
34.1
30.2
9.5
8.3
27.8
27.5
8.8
7.9
Marico
Neutral
317
-
40,934
6,430
7,349
18.8
19.5
6.4
7.7
49.6
41.2
15.0
12.6
33.2
32.5
6.2
5.4
Nestle*
Neutral
6,667
-
64,285
10,073
11,807
20.7
21.5
124.8
154.2
53.4
43.2
21.9
19.7
34.8
36.7
6.2
5.3
Tata Global
Neutral
154
-
9,745
8,675
9,088
9.8
9.8
7.4
8.2
20.9
18.8
1.7
1.6
7.9
8.1
1.0
1.0
Procter & Gamble
Neutral
8,041
-
26,100
2,939
3,342
23.2
23.0
146.2
163.7
55.0
49.1
13.9
11.6
25.3
23.5
8.4
7.3
Hygiene
IT
HCL Tech^
Buy
861
1,014
122,828
46,723
52,342
22.1
20.9
60.0
62.8
14.4
13.7
3.6
3.1
25.3
22.4
2.4
2.0
Infosys
Buy
949
1,179
217,900
68,484
73,963
26.0
26.0
63.0
64.0
15.1
14.8
3.2
2.9
20.8
19.7
2.9
2.5
TCS
Accumulate
2,510
2,651
494,627
117,966
127,403
27.5
27.6
134.3
144.5
18.7
17.4
5.6
5.2
29.8
29.7
3.8
3.6
Tech Mahindra
Buy
387
533
37,698
29,141
31,051
14.4
15.0
32.3
35.6
12.0
10.9
2.1
1.9
17.1
17.0
1.1
1.0
Wipro
Accumulate
537
570
130,595
55,421
58,536
20.3
20.3
35.1
36.5
15.3
14.7
2.7
2.3
19.2
14.6
1.8
1.5
Media
D B Corp
Neutral
369
-
6,782
2,297
2,590
27.4
28.2
21.0
23.4
17.6
15.8
4.1
3.6
23.7
23.1
2.8
2.4
HT Media
Neutral
83
-
1,933
2,693
2,991
12.6
12.9
7.9
9.0
10.5
9.2
0.9
0.8
7.8
8.3
0.3
0.2
Jagran Prakashan
Buy
186
225
6,081
2,283
2,555
28.0
28.0
10.6
12.3
17.5
15.2
3.7
3.2
21.4
21.4
2.7
2.3
Sun TV Network
Neutral
798
-
31,436
2,850
3,265
70.1
71.0
26.2
30.4
30.5
26.2
7.8
6.9
24.3
25.6
10.6
9.1
Hindustan Media
Neutral
277
-
2,032
1,016
1,138
24.3
25.2
27.3
30.1
10.1
9.2
1.9
1.7
16.2
15.8
1.3
1.1
Ventures
TV Today Network
Buy
266
344
1,586
608
667
21.5
22.3
15.7
19.2
17.0
13.8
2.6
2.2
16.1
16.0
2.2
1.9
Metals & Mining
Coal India
Neutral
262
-
162,417
84,638
94,297
21.4
22.3
24.5
27.1
10.7
9.7
4.4
4.2
42.6
46.0
1.4
1.3
Hind. Zinc
Neutral
242
-
102,168
14,252
18,465
55.9
48.3
15.8
21.5
15.3
11.3
2.5
2.2
17.0
20.7
7.2
5.5
Hindalco
Neutral
202
-
45,338
107,899
112,095
7.4
8.2
9.2
13.0
22.0
15.6
1.1
1.0
4.8
6.6
0.9
0.9
JSW Steel
Neutral
202
-
48,840
53,201
58,779
16.1
16.2
130.6
153.7
1.6
1.3
0.2
0.2
14.0
14.4
1.7
1.5
NMDC
Neutral
115
-
36,495
6,643
7,284
44.4
47.7
7.1
7.7
16.3
15.0
1.4
1.4
8.8
9.2
3.3
2.9
SAIL
Neutral
58
-
23,769
47,528
53,738
(0.7)
2.1
(1.9)
2.6
22.1
0.6
0.6
(1.6)
3.9
1.4
1.2
Vedanta
Neutral
245
-
90,978
71,744
81,944
19.2
21.7
13.4
20.1
18.3
12.2
1.6
1.4
8.4
11.3
1.7
1.3
Tata Steel
Neutral
506
-
49,173
121,374
121,856
7.2
8.4
18.6
34.3
27.2
14.8
1.7
1.6
6.1
10.1
1.0
1.0
Oil & Gas
GAIL
Neutral
381
-
64,430
56,220
65,198
9.3
10.1
27.1
33.3
14.1
11.4
1.3
1.2
9.3
10.7
1.3
1.1
ONGC
Neutral
169
-
217,074
137,222
152,563
15.0
21.8
19.5
24.1
8.7
7.0
0.7
0.7
8.5
10.1
1.9
1.7
Indian Oil Corp
Neutral
420
-
203,972
373,359
428,656
5.9
5.5
54.0
59.3
7.8
7.1
1.2
1.1
16.0
15.6
0.7
0.6
Stock Watch
June 12, 2017
Company Name
Reco
CMP
Target
Mkt Cap
Sales ( Čcr )
OPM(%)
EPS (Č)
PER(x)
P/BV(x)
RoE(%)
EV/Sales(x)
(Č)
Price ( Č)
( Č cr )
FY17E FY18E
FY17E
FY18E
FY17E
FY18E
FY17E
FY18E
FY17E
FY18E
FY17E
FY18E
FY17E
FY18E
Oil & Gas
Reliance Industries
Neutral
1,336
-
434,229
301,963
358,039
12.1
12.6
87.7
101.7
15.2
13.1
1.6
1.4
10.7
11.3
1.9
1.6
Pharmaceuticals
Alembic Pharma
Buy
552
648
10,414
3,101
3,966
19.7
20.5
21.4
25.5
25.8
21.7
5.5
4.5
23.0
22.8
3.3
2.5
Alkem Laboratories Ltd
Accumulate
1,890
2,161
22,599
5,853
6,901
17.1
18.4
74.6
85.0
25.3
22.2
5.3
4.5
21.1
20.2
3.8
3.3
Aurobindo Pharma
Buy
609
823
35,660
14,845
17,086
21.5
22.1
39.4
44.7
15.5
13.6
3.8
3.0
27.6
24.7
2.6
2.2
Aventis*
Neutral
4,051
-
9,330
2,206
2,508
16.6
16.8
128.9
139.9
31.4
29.0
5.4
4.2
21.6
23.5
4.0
3.3
Cadila Healthcare
Neutral
541
-
55,354
9,220
11,584
18.4
20.3
14.5
18.7
37.3
28.9
8.0
6.4
23.5
24.6
6.3
4.8
Cipla
Sell
550
465
44,251
15,378
18,089
15.7
16.8
19.3
24.5
28.5
22.5
3.3
3.0
12.3
13.9
3.0
2.6
Dr Reddy's
Neutral
2,631
-
43,582
14,081
15,937
16.1
18.6
72.6
105.9
36.2
24.8
3.6
3.2
9.6
13.6
3.3
2.9
Dishman Pharma
Sell
143
1,718
1,890
22.7
22.8
9.5
11.3
10.1
10.9
3.3
2.9
GSK Pharma*
Neutral
2,463
-
20,859
2,927
3,290
11.8
16.2
34.4
49.6
71.6
49.7
10.4
10.8
13.9
21.3
6.9
6.2
Indoco Remedies
Buy
193
240
1,778
1,112
1,289
16.2
18.2
11.6
16.0
16.6
12.1
2.7
2.2
17.0
20.1
1.7
1.4
Ipca labs
Buy
501
613
6,323
3,258
3,747
12.8
15.3
12.1
19.2
41.4
26.1
2.6
2.4
6.4
9.5
2.1
1.8
Lupin
Buy
1,161
1,809
52,424
15,912
18,644
26.4
26.7
58.1
69.3
20.0
16.8
3.9
3.2
21.4
20.9
3.4
2.7
Natco Pharma
Neutral
1,077
-
18,781
2,065
1,988
33.1
33.7
27.9
25.7
38.6
41.9
11.3
9.6
29.2
22.9
9.2
9.3
Sun Pharma
Buy
525
847
125,912
31,129
35,258
32.0
32.9
30.2
35.3
17.4
14.9
2.8
2.3
20.0
20.1
3.6
3.0
Power
Tata Power
Neutral
78
-
21,043
36,916
39,557
17.4
27.1
5.1
6.3
15.3
12.4
1.3
1.2
9.0
10.3
1.6
1.4
NTPC
Neutral
158
-
130,196
86,605
95,545
17.5
20.8
11.8
13.4
13.4
11.8
1.4
1.3
10.5
11.1
2.8
2.8
Power Grid
Accumulate
207
223
108,163
25,315
29,193
88.2
88.7
14.2
17.2
14.6
12.1
2.2
1.9
15.2
16.1
8.9
8.0
Real Estate
Prestige Estate
Neutral
253
-
9,499
4,707
5,105
25.2
26.0
10.3
13.0
24.6
19.5
2.0
1.8
10.3
10.2
3.2
2.8
MLIFE
Buy
419
522
2,148
1,152
1,300
22.7
24.6
29.9
35.8
14.0
11.7
1.0
1.0
7.6
8.6
2.6
2.2
Telecom
Bharti Airtel
Neutral
368
-
147,064
105,086
114,808
34.5
34.7
12.2
16.4
30.2
22.4
2.0
1.9
6.8
8.4
2.3
2.0
Idea Cellular
Neutral
79
-
28,452
40,133
43,731
37.2
37.1
6.4
6.5
12.3
12.1
1.0
1.0
8.2
7.6
1.7
1.5
zOthers
Abbott India
Neutral
4,237
-
9,004
3,153
3,583
14.1
14.4
152.2
182.7
27.8
23.2
136.7
116.7
25.6
26.1
2.6
2.2
Asian Granito
Accumulate
394
447
1,185
1,066
1,169
11.6
12.5
13.0
16.0
30.3
24.7
3.0
2.6
9.5
10.7
1.4
1.2
Bajaj Electricals
Accumulate
350
395
3,547
4,801
5,351
5.7
6.2
10.4
13.7
33.6
25.6
4.2
3.7
12.4
14.5
0.7
0.7
Banco Products (India)
Neutral
222
-
1,585
1,353
1,471
12.3
12.4
14.5
16.3
15.3
13.6
21.1
19.0
14.5
14.6
1.1
119.4
Coffee Day Enterprises
Neutral
248
-
5,108
2,964
3,260
20.5
21.2
4.7
8.0
-
31.0
2.9
2.6
5.5
8.5
2.1
1.9
Ltd
Competent Automobiles Neutral
198
-
127
1,137
1,256
3.1
2.7
28.0
23.6
7.1
8.4
38.1
34.4
14.3
11.5
0.1
0.1
Elecon Engineering
Neutral
63
-
712
1,482
1,660
13.7
14.5
3.9
5.8
16.3
10.9
3.8
3.5
7.8
10.9
0.8
0.7
Stock Watch
June 12, 2017
Company Name
Reco
CMP
Target
Mkt Cap
Sales ( Čcr )
OPM(%)
EPS (Č)
PER(x)
P/BV(x)
RoE(%)
EV/Sales(x)
(Č)
Price ( Č)
( Č cr )
FY17E
FY18E
FY17E
FY18E
FY17E
FY18E
FY17E
FY18E
FY17E
FY18E
FY17E
FY18E
FY17E
FY18E
zOthers
Finolex Cables
Neutral
507
-
7,748
2,883
3,115
12.0
12.1
14.2
18.6
35.7
27.2
19.0
16.6
15.8
14.6
2.4
2.2
Garware Wall Ropes
Neutral
820
-
1,795
863
928
15.1
15.2
36.4
39.4
22.5
20.8
4.1
3.5
17.5
15.9
2.0
1.8
Goodyear India*
Neutral
885
-
2,040
1,598
1,704
10.4
10.2
49.4
52.6
17.9
16.8
82.7
72.5
18.2
17.0
1.0
137.2
Hitachi
Neutral
2,049
-
5,572
2,081
2,433
8.8
8.9
33.4
39.9
61.4
51.4
49.5
41.3
22.1
21.4
2.7
2.3
HSIL
Neutral
352
-
2,548
2,384
2,515
15.8
16.3
15.3
19.4
23.0
18.2
22.9
19.7
7.8
9.3
1.2
1.1
Interglobe Aviation
Neutral
1,151
-
41,624
21,122
26,005
14.5
27.6
110.7
132.1
10.4
8.7
62.2
44.4
168.5
201.1
1.9
1.5
Jyothy Laboratories
Neutral
385
-
7,001
1,440
2,052
11.5
13.0
8.5
10.0
45.3
38.5
11.0
10.2
18.6
19.3
5.1
3.6
Kirloskar Engines India
Neutral
385
-
5,565
2,554
2,800
9.9
10.0
10.5
12.1
36.7
31.8
15.3
14.5
10.7
11.7
1.8
1.6
Ltd
Linc Pen & Plastics
Neutral
262
-
388
382
420
9.3
9.5
13.5
15.7
19.5
16.7
3.3
2.9
17.1
17.3
1.1
1.0
M M Forgings
Neutral
610
-
736
546
608
20.4
20.7
41.3
48.7
14.8
12.5
83.6
74.0
16.6
17.0
1.2
1.1
Manpasand Bever.
Neutral
769
-
4,400
836
1,087
19.6
19.4
16.9
23.8
45.5
32.3
5.5
4.8
12.0
14.8
5.0
3.8
Mirza International
Neutral
156
-
1,873
963
1,069
17.2
18.0
6.1
7.5
25.4
20.7
3.9
3.3
15.0
15.7
2.2
1.9
MT Educare
Neutral
65
-
257
366
417
17.7
18.2
9.4
10.8
6.9
6.0
1.5
1.3
22.2
22.3
0.6
0.5
Narayana Hrudaya
Neutral
333
-
6,805
1,873
2,166
11.5
11.7
2.6
4.0
125.9
84.0
7.7
7.0
6.1
8.3
3.7
3.2
Navkar Corporation
Buy
219
265
3,129
347
371
43.2
37.3
6.7
6.0
32.9
36.6
2.3
2.0
6.2
10.6
10.1
9.5
Navneet Education
Neutral
190
-
4,439
1,062
1,147
24.0
24.0
6.1
6.6
31.2
28.7
6.4
5.7
20.6
19.8
4.3
3.9
Nilkamal
Neutral
2,012
-
3,002
1,995
2,165
10.7
10.4
69.8
80.6
28.8
25.0
115.0
99.9
16.6
16.5
1.5
1.3
Page Industries
Neutral
16,164
-
18,029
2,450
3,124
20.1
17.6
299.0
310.0
54.1
52.1
360.0
274.8
47.1
87.5
7.4
5.8
Parag Milk Foods
Neutral
230
-
1,933
1,919
2,231
9.3
9.6
9.5
12.9
24.3
17.8
3.8
3.1
15.5
17.5
1.2
1.0
Quick Heal
Neutral
214
-
1,502
408
495
27.3
27.0
7.7
8.8
27.7
24.4
2.6
2.6
9.3
10.6
2.8
2.3
Radico Khaitan
Buy
128
147
1,698
1,667
1,824
13.0
13.2
6.7
8.2
19.2
15.6
1.7
1.6
9.0
10.2
1.4
1.3
Relaxo Footwears
Neutral
488
-
5,858
2,085
2,469
9.2
8.2
7.6
8.0
64.5
61.4
25.0
21.4
17.9
18.8
2.9
2.5
S H Kelkar & Co.
Neutral
291
-
4,203
1,036
1,160
15.1
15.0
6.1
7.2
47.6
40.5
5.1
4.7
10.7
11.5
3.9
3.5
Siyaram Silk Mills
Accumulate
2,325
2,500
2,179
1,574
1,769
12.5
12.7
97.1
113.1
23.9
20.6
3.7
3.2
15.4
15.5
1.6
1.4
Styrolution ABS India*
Neutral
833
-
1,466
1,440
1,537
9.2
9.0
40.6
42.6
20.5
19.6
52.4
47.7
12.3
11.6
1.0
0.9
Surya Roshni
Neutral
289
-
1,266
3,342
3,625
7.8
7.5
17.3
19.8
16.7
14.6
31.7
25.5
10.5
10.8
0.6
0.6
Team Lease Serv.
Neutral
1,288
-
2,202
3,229
4,001
1.5
1.8
22.8
32.8
56.6
39.2
6.1
5.3
10.7
13.4
0.6
0.5
The Byke Hospitality
Neutral
190
-
760
287
384
20.5
20.5
7.6
10.7
25.0
17.7
5.2
4.2
20.7
23.5
2.7
2.0
Transport Corporation of
Neutral
314
-
2,401
2,671
2,911
8.5
8.8
13.9
15.7
22.6
20.0
3.1
2.8
13.7
13.8
1.0
0.9
India
Stock Watch
June 12, 2017
Company Name
Reco
CMP
Target Mkt Cap
Sales ( Čcr )
OPM(%)
EPS (Č)
PER(x)
P/BV(x)
RoE(%)
EV/Sales(x)
(Č)
Price ( Č)
( Č cr )
FY17E FY18E FY17E FY18E FY17E FY18E FY17E FY18E FY17E FY18E FY17E FY18E FY17E FY18E
zOthers
TVS Srichakra
Neutral
4,130
-
3,162
2,304
2,614
13.7
13.8
231.1
266.6
17.9
15.5
464.1
365.4
33.9
29.3
1.4
1.2
UFO Moviez
Neutral
381
-
1,051
619
685
33.2
33.4
30.0
34.9
12.7
10.9
1.8
1.5
13.8
13.9
1.4
1.1
Visaka Industries
Neutral
461
-
731
1,051
1,138
10.3
10.4
21.0
23.1
21.9
19.9
59.1
55.3
9.0
9.2
1.0
0.9
VRL Logistics
Neutral
326
-
2,979
1,902
2,119
16.7
16.6
14.6
16.8
22.4
19.4
4.9
4.3
21.9
22.2
1.7
1.5
VIP Industries
Accumulate
195
218
2,759
1,270
1,450
10.4
10.4
5.6
6.5
34.9
30.0
7.2
6.3
20.7
21.1
2.2
1.9
Navin Fluorine
Accumulate
3,187
3,650
3,121
789
945
21.1
22.4
120.1
143.4
26.5
22.2
4.3
3.7
17.8
18.5
3.9
3.2
Source: Company, Angel Research; Note: *December year end; #September year end; &October year end; Price as on June 09, 2017
Market Outlook
June 12, 2017
Research Team Tel: 022 - 39357800
DISCLAIMER
Angel Broking Private Limited (hereinafter referred to as “Angel”) is a registered Member of National Stock Exchange of India
Limited,Bombay Stock Exchange Limited and Metropolitan Stock Exchange Limited. It is also registered as a Depository Participant with
CDSL and Portfolio Manager with SEBI. It also has registration with AMFI as a Mutual Fund Distributor. Angel Broking Private Limited is a
registered entity with SEBI for Research Analyst in terms of SEBI (Research Analyst) Regulations, 2014 vide registration number
INH000000164. Angel or its associates has not been debarred/ suspended by SEBI or any other regulatory authority for accessing
/dealing in securities Market. Angel or its associates/analyst has not received any compensation / managed or
co-managed public offering of securities of the company covered by Analyst during the past twelve months.
This document is solely for the personal information of the recipient, and must not be singularly used as the basis of any investment
decision. Nothing in this document should be construed as investment or financial advice. Each recipient of this document should make
such investigations as they deem necessary to arrive at an independent evaluation of an investment in the securities of the companies
referred to in this document (including the merits and risks involved), and should consult their own advisors to determine the merits and
risks of such an investment.
Reports based on technical and derivative analysis center on studying charts of a stock's price movement, outstanding positions and
trading volume, as opposed to focusing on a company's fundamentals and, as such, may not match with a report on a company's
fundamentals. Investors are advised to refer the Fundamental and Technical Research Reports available on our website to evaluate the
contrary view, if any.
The information in this document has been printed on the basis of publicly available information, internal data and other reliable
sources believed to be true, but we do not represent that it is accurate or complete and it should not be relied on as such, as this
document is for general guidance only. Angel Broking Pvt. Limited or any of its affiliates/ group companies shall not be in any way
responsible for any loss or damage that may arise to any person from any inadvertent error in the information contained in this report.
Angel Broking Pvt. Limited has not independently verified all the information contained within this document. Accordingly, we cannot
testify, nor make any representation or warranty, express or implied, to the accuracy, contents or data contained within this document.
While Angel Broking Pvt. Limited endeavors to update on a reasonable basis the information discussed in this material, there may be
regulatory, compliance, or other reasons that prevent us from doing so.
This document is being supplied to you solely for your information, and its contents, information or data may not be reproduced,
redistributed or passed on, directly or indirectly.
Neither Angel Broking Pvt. Limited, nor its directors, employees or affiliates shall be liable for any loss or damage that may arise from
or in connection with the use of this information.